Color Crafting: Automating the Construction of Designer Quality Color Ramps
 (3.4Mb) Stephen Smart, Keke Wu, & Danielle Albers Szafir. Color Crafting: Automating the Construction of Designer Quality Color Ramps. IEEE Transactions on Visualization and Computer Graphics, 26(1), 2020 (to appear). [Published as part of the Proceedings of IEEE VIS 2019]
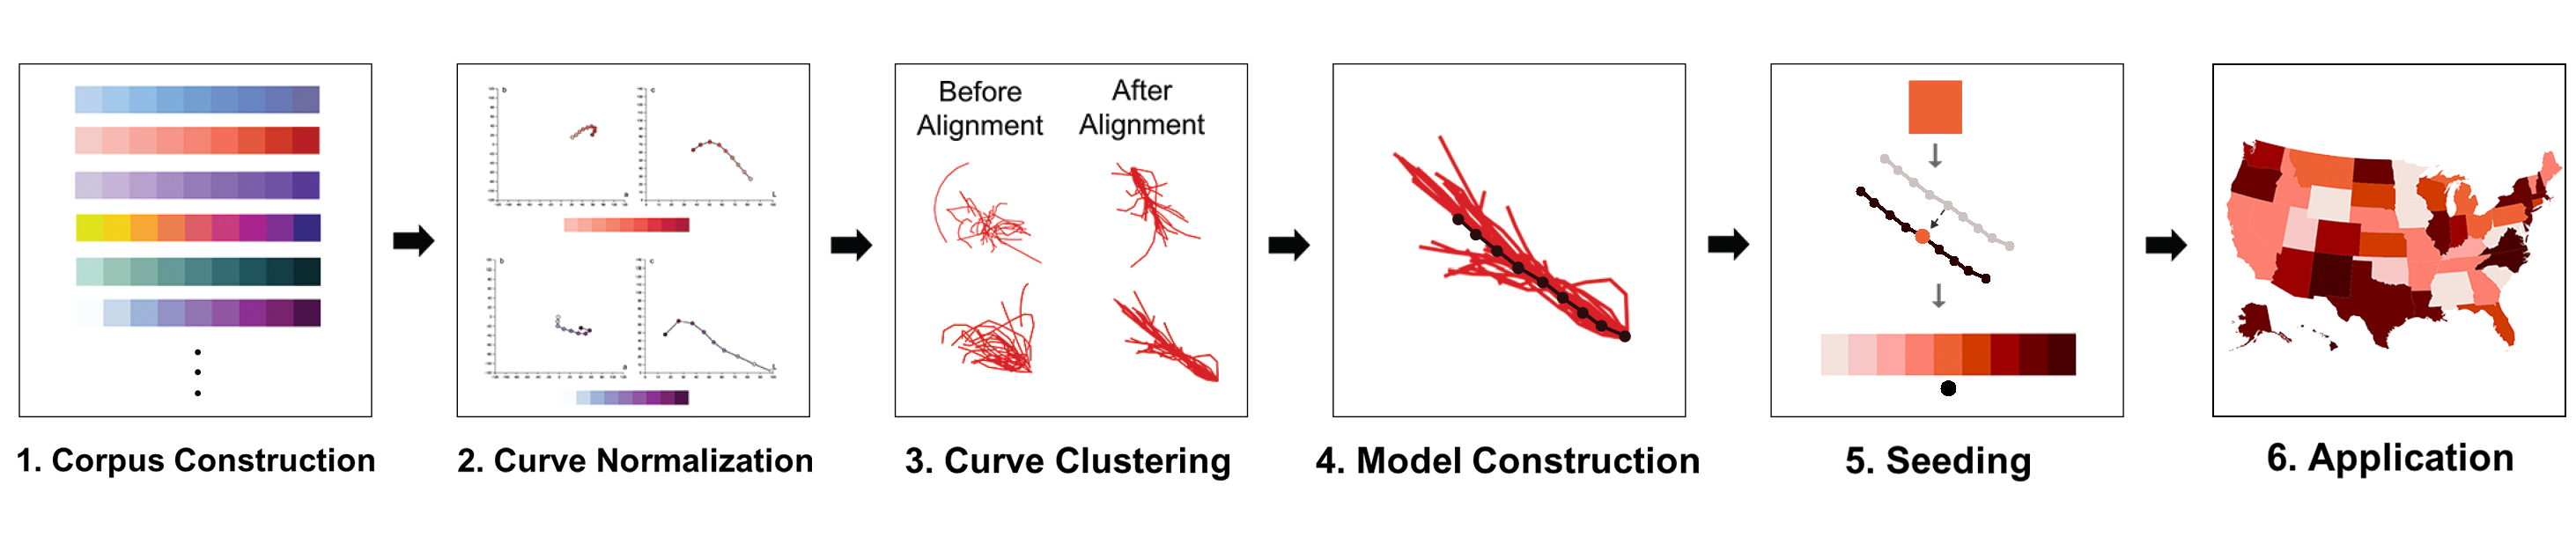
Abstract: Visualizations often encode numeric data using sequential and diverging color ramps. Effective ramps use colors that are sufficiently discriminable, align well with the data, and are aesthetically pleasing. Designers rely on years of experience to create high-quality color ramps. However, it is challenging for novice visualization developers that lack this experience to craft effective ramps as most guidelines for constructing ramps are loosely defined qualitative heuristics that are often difficult to apply. Our goal is to enable visualization developers to readily create effective color encodings using a single seed color. We do this using an algorithmic approach that models designer practices by analyzing patterns in the structure of designer-crafted color ramps. We construct these models from a corpus of 222 expert-designed color ramps, and use the results to automatically generate ramps that mimic designer practices. We evaluate our approach through an empirical study comparing the outputs of our approach with designer-crafted color ramps. Our models produce ramps that support accurate and aesthetically pleasing visualizations at least as well as designer ramps and that outperform conventional mathematical approaches.
This tool allows you to explore the ramps, clusters, and models generated by the Color Crafting algorithm. Click on a link below to view the models. The K-Means models were generated using K-Means clustering while the Bayesian models were generated using the Bayesian Curve Clustering approach from Zhang, Pati, & Shrivastava. The Full Dataset provides a listing of all ramps in our training corpus.
OSF RepositoryK-Means Cluster Viewer
Bayesian Cluster Viewer
Full Dataset (including divergent ramps)
Note that the a* and b* planes on the clustered view express relative relationships: the curves in these views have been axis aligned. However, inversion has not been added in these visualizations.