The CU VisuaLab provides an opportunity for researchers to come together to tackle innovative questions about visualization, data analytics, and computer graphics driven by real-world challenges. Below is a sample of on-going projects in the VisuaLab. For more information about these projects or others, please contact Dr. Szafir.
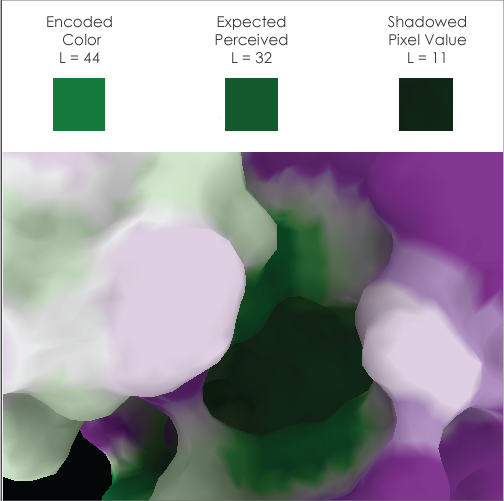 |
Color is commonly used to encode values in a visualization. However, we know little about how the complexities of visualization impact color encoding perception and design. Shape, size, shading, and even viewing device all manipulate the colors that people will see in a visualization, and subsequently their ability to effectively use that visualization. We leverage sampling-based models to better understand and predict how color manifests in different types of visualizations. How do the marks used in a visualization impact their perceptions? How can we create encodings that are robust to the ubiquity of visualizations? How can we empower designers to craft effective color encodings? This project also explores how these questions impact encodings beyond color to design tools that pair perception and automation to encourage more effective visualization. VisuaLab Personnel: Stephen Smart, Keke Wu
Example Publications: |

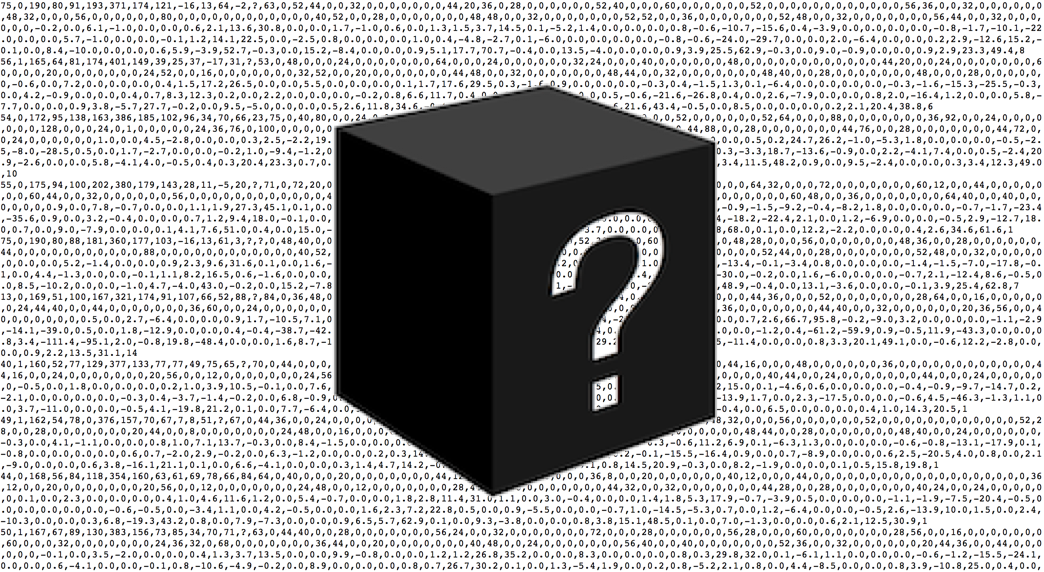 |
As the volume of available data increases, analytics systems must leverage automated analysis methods to make sense of data. However, these methods often remove expert knowledge from the analytic process, obscuring important patterns and leveraging black-box statistical methods. In these projects, we explore how visualizations might enable fluid collaboration between analysts and statistical methods to reintegrate people into big data processes. Our systems explore how people might leverage data synthesized across multiple sources, how statistical processes might learn from expert behavior, and how analysts can intuitively provide input into statistical processes. This research also examines how interactive visualizations may help analysts understand the processes underlying machine learning to reduce barriers to its use and interpretation in practice. VisuaLab Personnel: David Burlinson, Tetsumichi Umada Example Publications: |
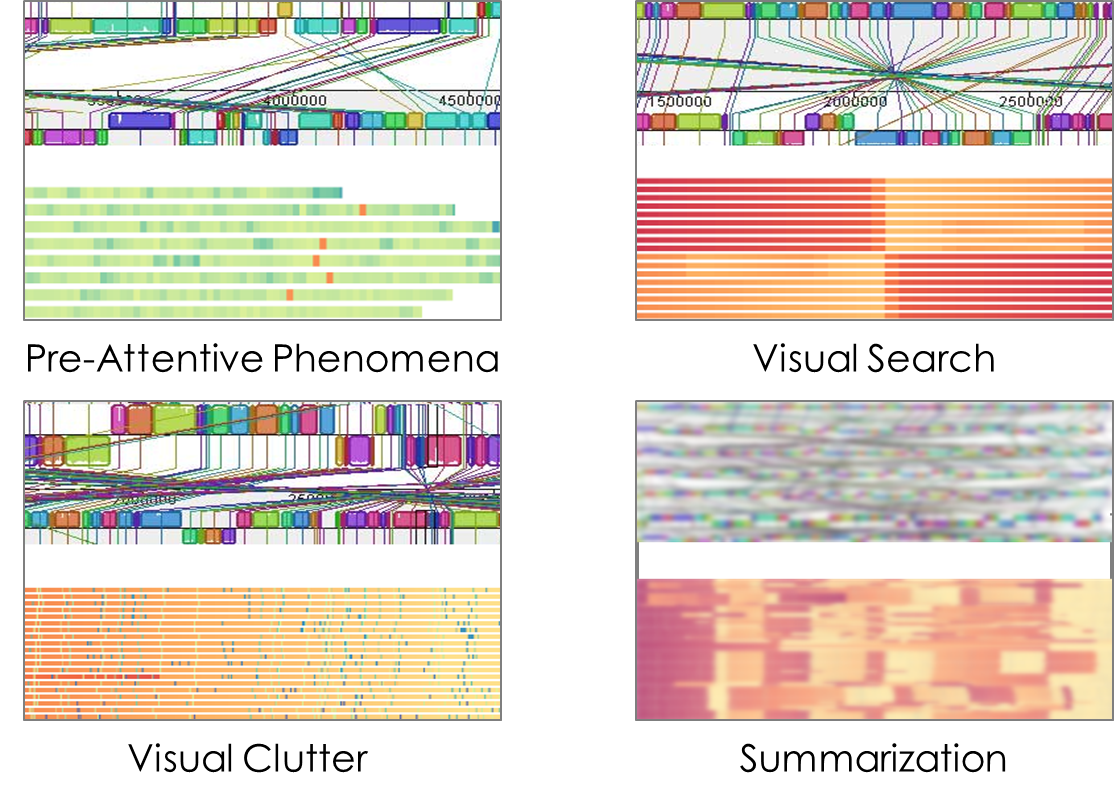 |
Our understanding of visualization design is conventionally based on how well people can compare pairs of points. As people face more and more data, visualization must move beyond small-scale design thinking to understand how design might support people in understanding large collections of datapoints. Drawing from psychology, this work seeks to understand how people estimate properties across collections of points in a visualization (a process known as visual aggregation) through experimentation, and how visualizations might be designed to support these judgments. The results from these efforts have driven scalable systems in domains ranging from biology to the humanities. VisuaLab Personnel: Stephen Smart, David Burlinson Example Publications: |
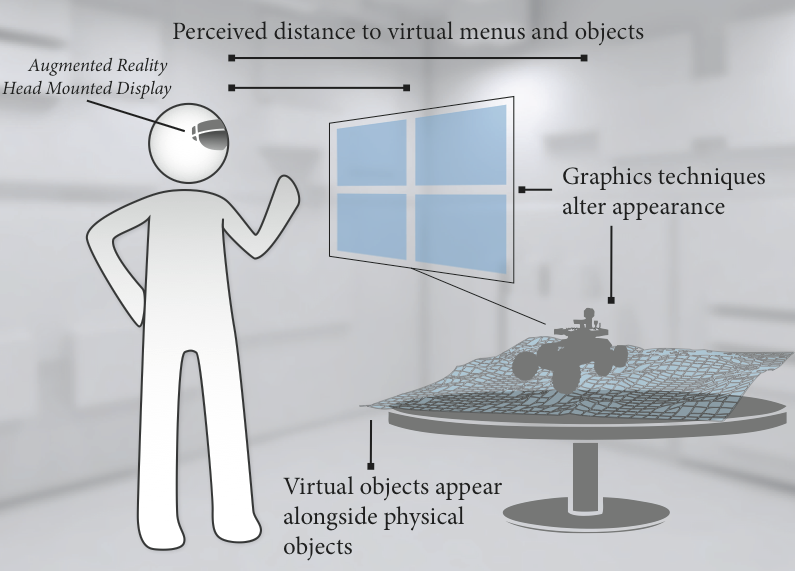 |
The space of consumer display technologies is evolving rapidly. This provides people with access to displays of different shapes, sizes, and capabilities, such as mobile phones, HMDs, and smartwatches. New displays afford new opportunities for analytics tools that help people make sense of our increasingly data-driven world. This project looks at how people perceive and interact with visual information with different display technologies. We develop guidelines, techniques, and tools that effectively leverage the capabilities of these technologies to enhance the ubiquity, accessibility, and effectiveness of data analytics and immersive visual applications. VisuaLab Personnel: Matt Whitlock, Keke Wu Example Publications: |